Welcome to our Interactive Incident Map! This powerful tool helps you explore reported security incidents, using a visual interface, to make informed decisions about your cruising plans. Use it to see where incidents have occurred, read the detailed reports, and search by location, time, event type, or specific keyword.
What You'll Find on the Map Page
When you visit our Interactive Incident Map, you'll see four main components working together:
Filter Controls: Search tools to narrow down exactly what you want to see
Incident Listing: Detailed list below the map showing all matching incidents
Share Button: Create bookmarkable links to save and share your searches
1. Map Navigation & Interactions
Basic Map Controls
Zoom & Pan: Use "+" / "–" buttons, mouse scroll wheel, or pinch gestures (on mobile devices) to zoom. Click and drag to move around
Fullscreen Mode: Click the fullscreen icon for a larger, distraction-free view – especially useful when analyzing complex incident patterns, doing detailed research, or working on smaller screens
Understanding Clusters and Spiderfy
Clustering: When many incidents occur close together, they form numbered clusters (e.g., a circle with "8" means 8 incidents)
Spiderfy: Click a cluster to either zoom, or "fan out" overlapping incidents in a spiral pattern, letting you access each marker individually. Note that markers remain color-coded and a legend appears beneath the map.
Marker Details: Click any individual marker to open a detailed panel with full incident information
Example:
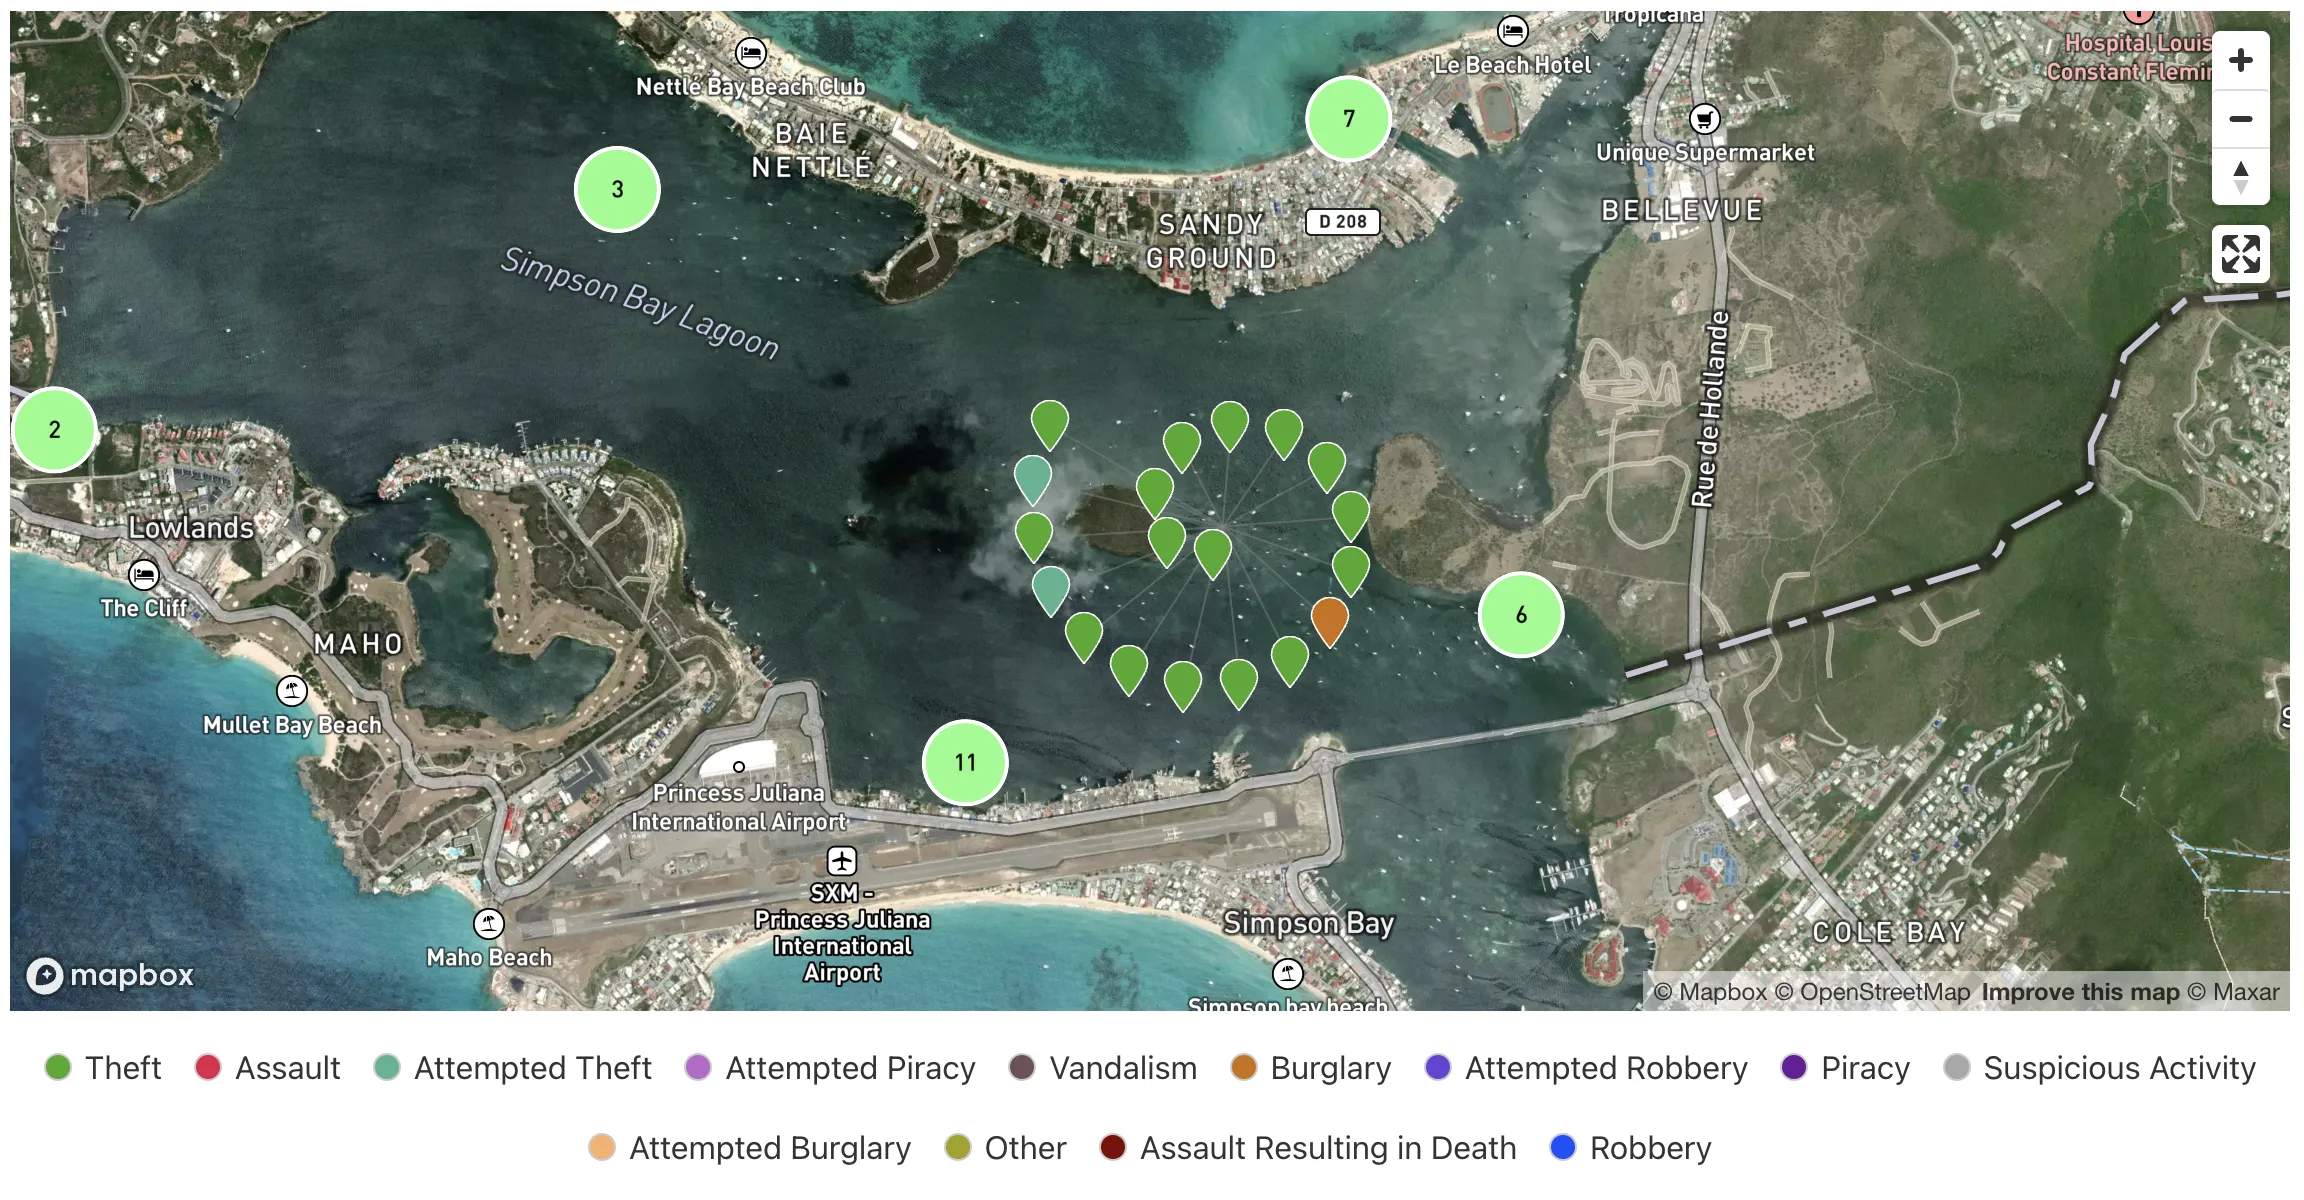
You're researching the Leeward Islands and see a cluster marked "19" near Simpson Bay, St Martin. Click it and the markers spread out in a circle or spiral, showing individual incidents near Simpson Bay Lagoon. Notice they are color-coded with a legend below the map. Now you can click each marker to read specific details about what happened.
Example of markers "spiderfying" into a spiral pattern when you click on a cluster
Research Tip: Use fullscreen mode when doing detailed analysis. The larger view makes it easier to see cluster patterns, read incident details in the side panel, and work with multiple filters simultaneously – especially valuable when planning routes or researching specific security concerns.
2. Search and Filter Your Way to Useful Information
Filter Options
Some filters support multiple selections (✅), so you can mix and match to find exactly what you need:
✅ Year: Compare incidents across different time periods
✅ Event Type: Focus on specific types like Theft, Piracy, or Robbery
✅ Country: Research particular destinations
Keyword Search: Find specific details, equipment, or locations – you can even filter/search at the anchorage level
Incident ID: Jump directly to a specific report if you know the number
Powerful Search
The search box is your most powerful tool. It searches across:
Incident descriptions: What actually happened
Stolen items: Specific equipment, brands, model numbers – even serial numbers when provided by victims
Location details: Marina names, anchorage names, local areas
Security measures: What protection was (or wasn't) in place
Example:
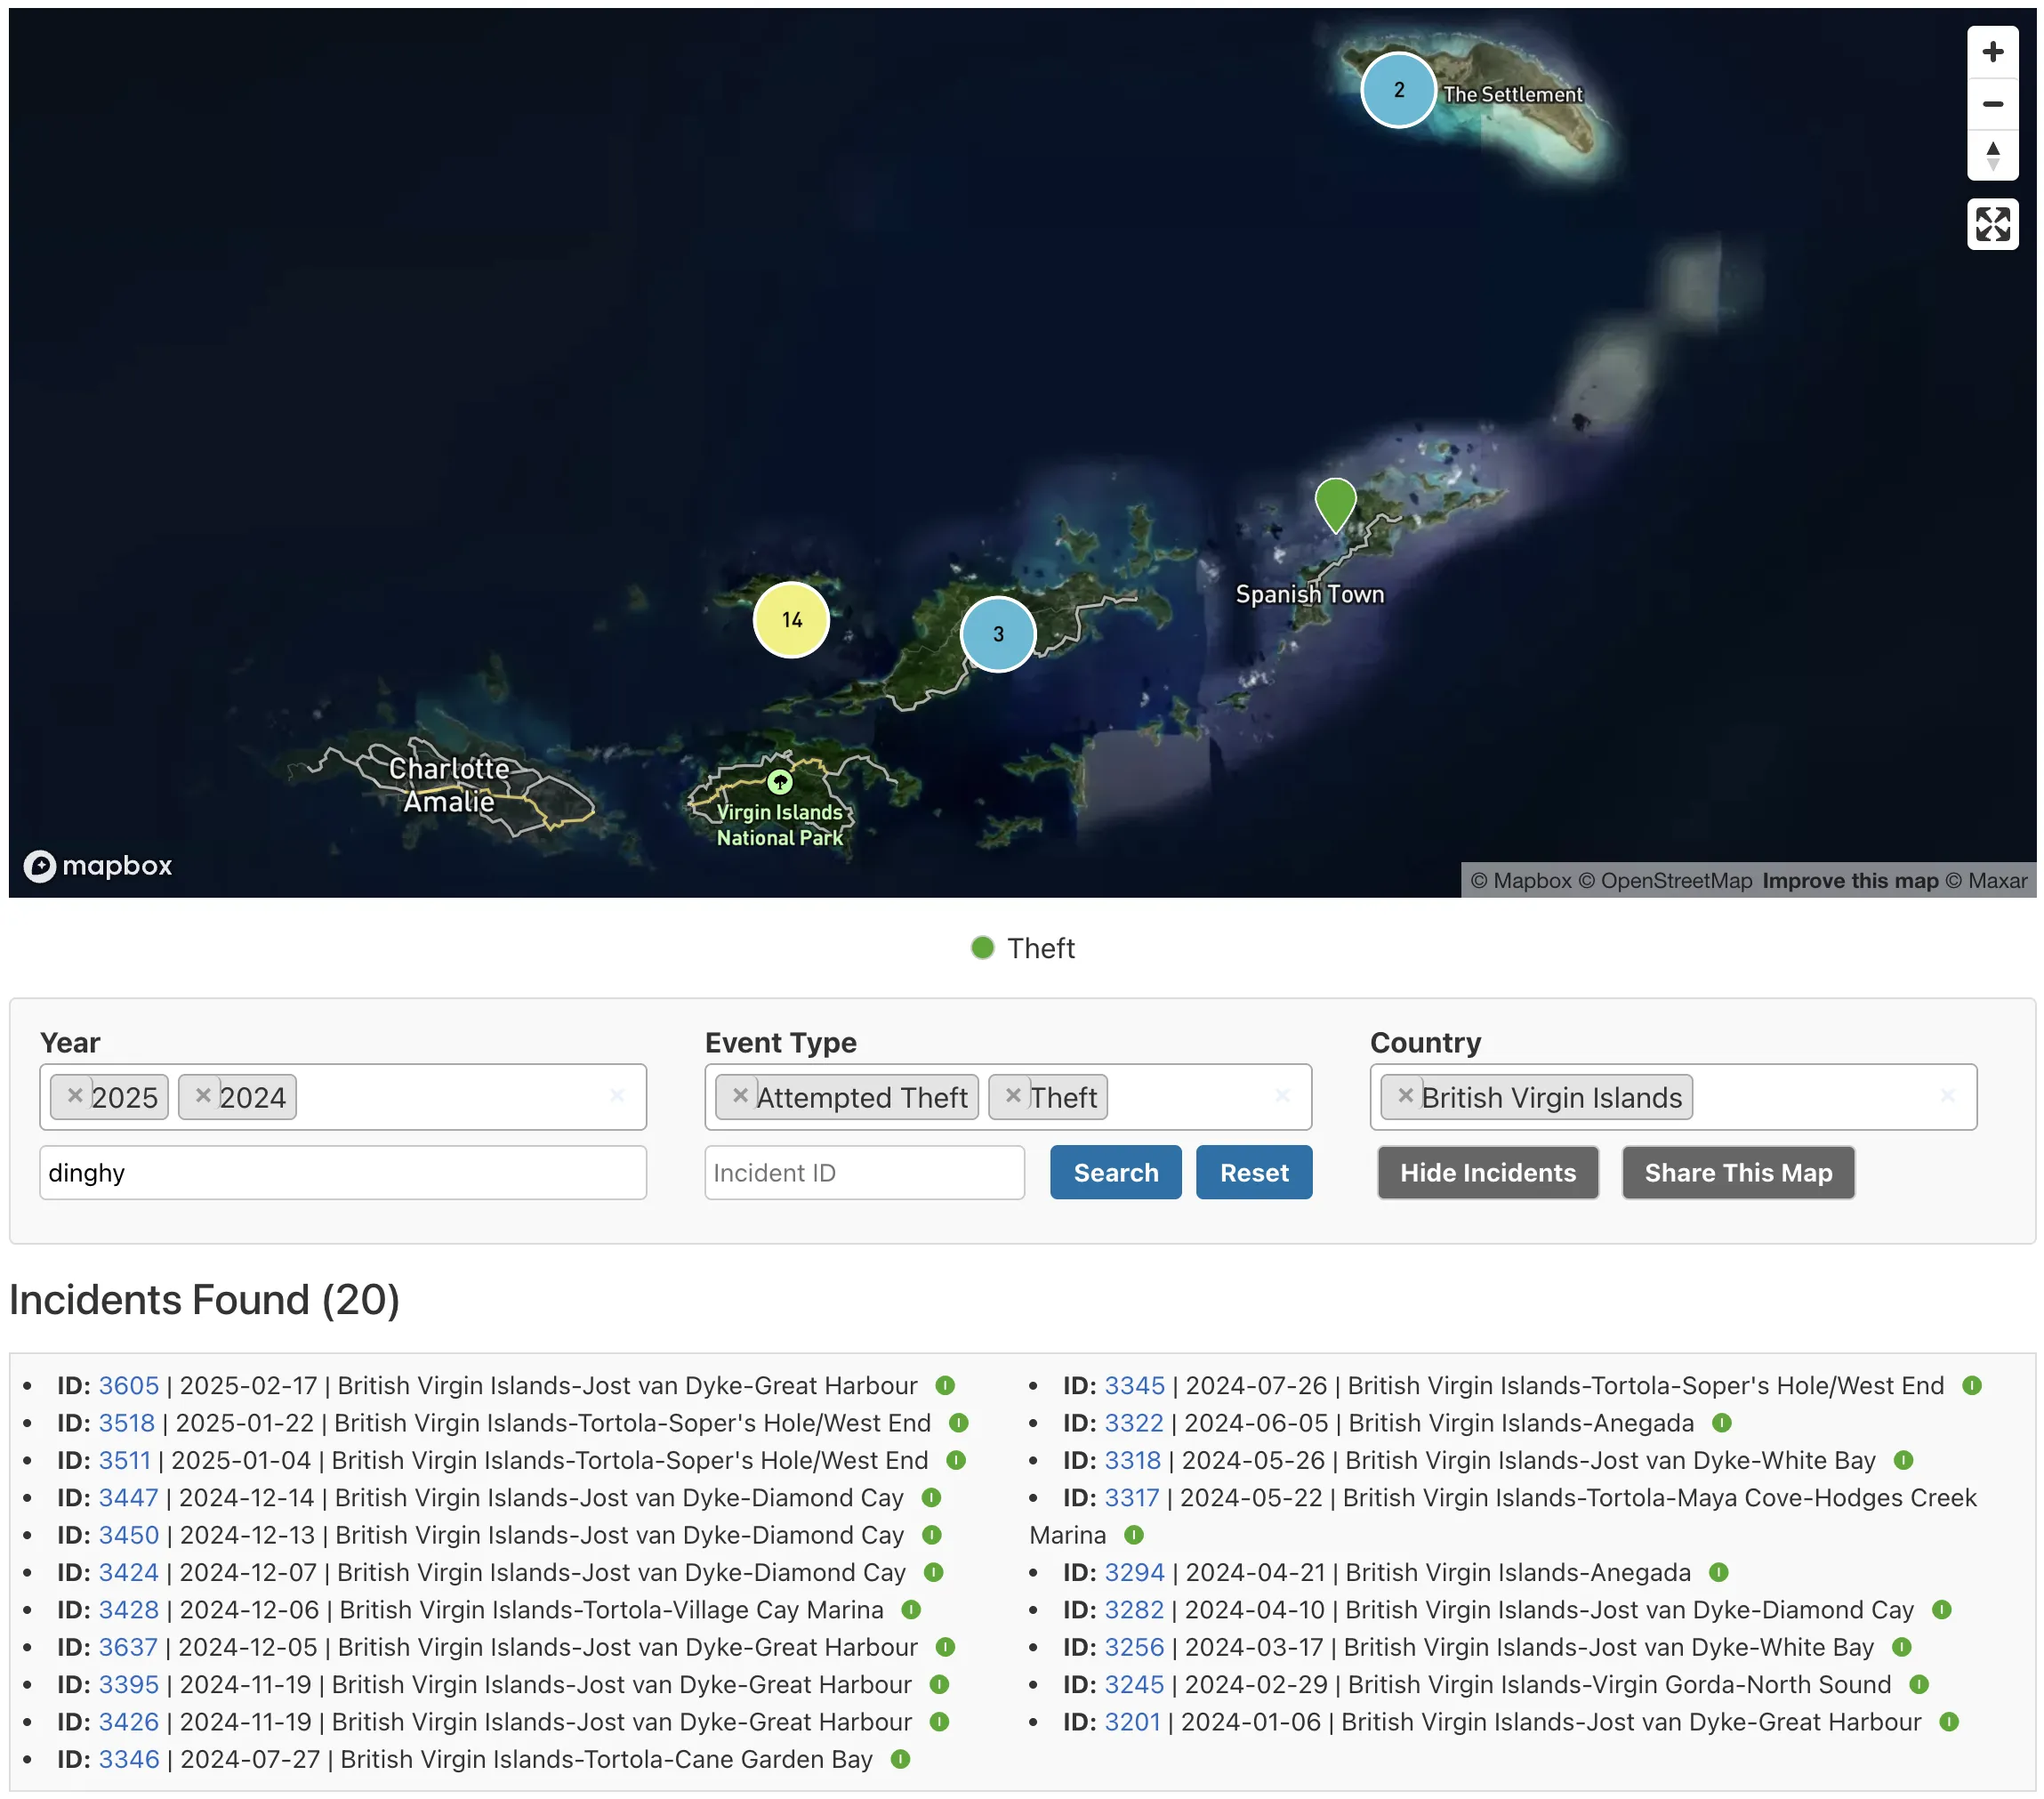
You're planning to visit the BVI and want to know about dinghy security. You filter for the years "2024 & 2025", "BVI", "Theft & Attempted Theft", and a free text Keyword "dinghy". The results show you exactly where dinghy thefts have been reported, what security was used, and what time of day incidents occurred.
Example of the search and filter interface showing multiple filter options and keyword search functionality
3. Reading Incident Details
Side Panel Information
Click any marker to open a detailed panel showing:
Incident ID and Event Type (color-coded for easy recognition)
Date & Time: When the incident occurred
Location Details: Country, island, anchorage, marina, or specific area
Security Measures: What protection was in place (if any)
Full Description: Detailed account of what happened, with links to complete reports
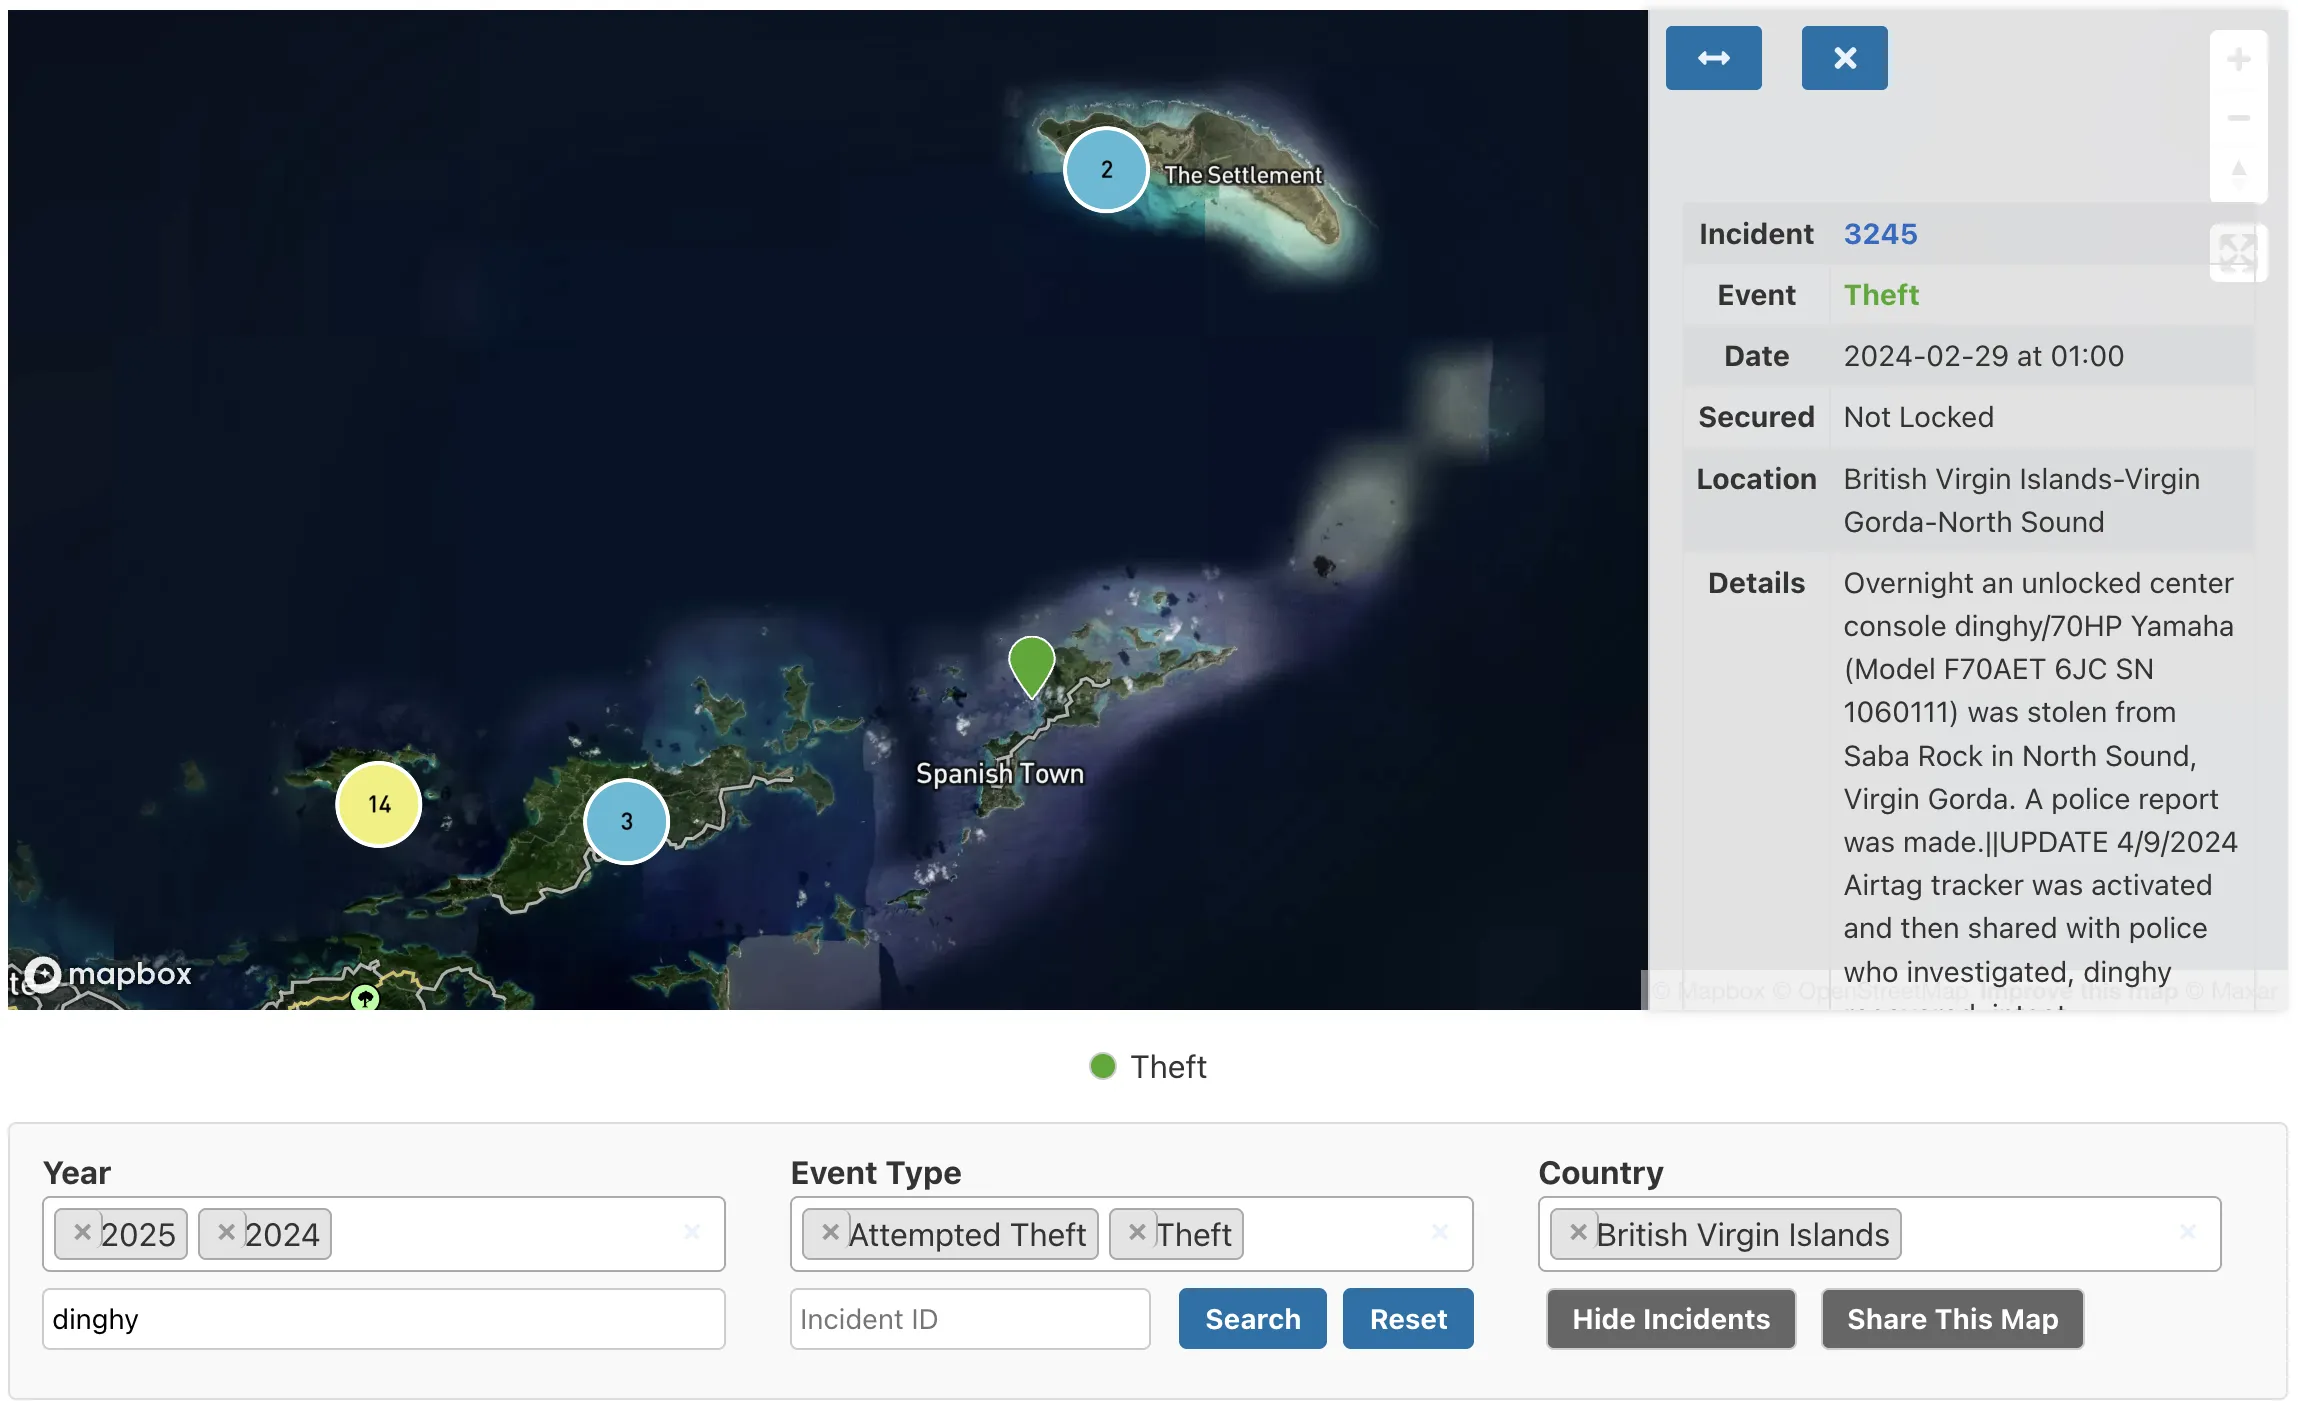
Example of detailed incident information displayed when clicking on a map marker
Incident Listing Below Map
Below the map, you'll see "Incidents Found (X)" – a comprehensive list of all incidents matching your search:
Sortable by date (newest incidents first)
Clickable incident IDs that link to full reports
Location information in easy-to-read format
Info icons (🅘) you can hover over for quick summaries
Show/Hide toggle to focus on just the map when needed
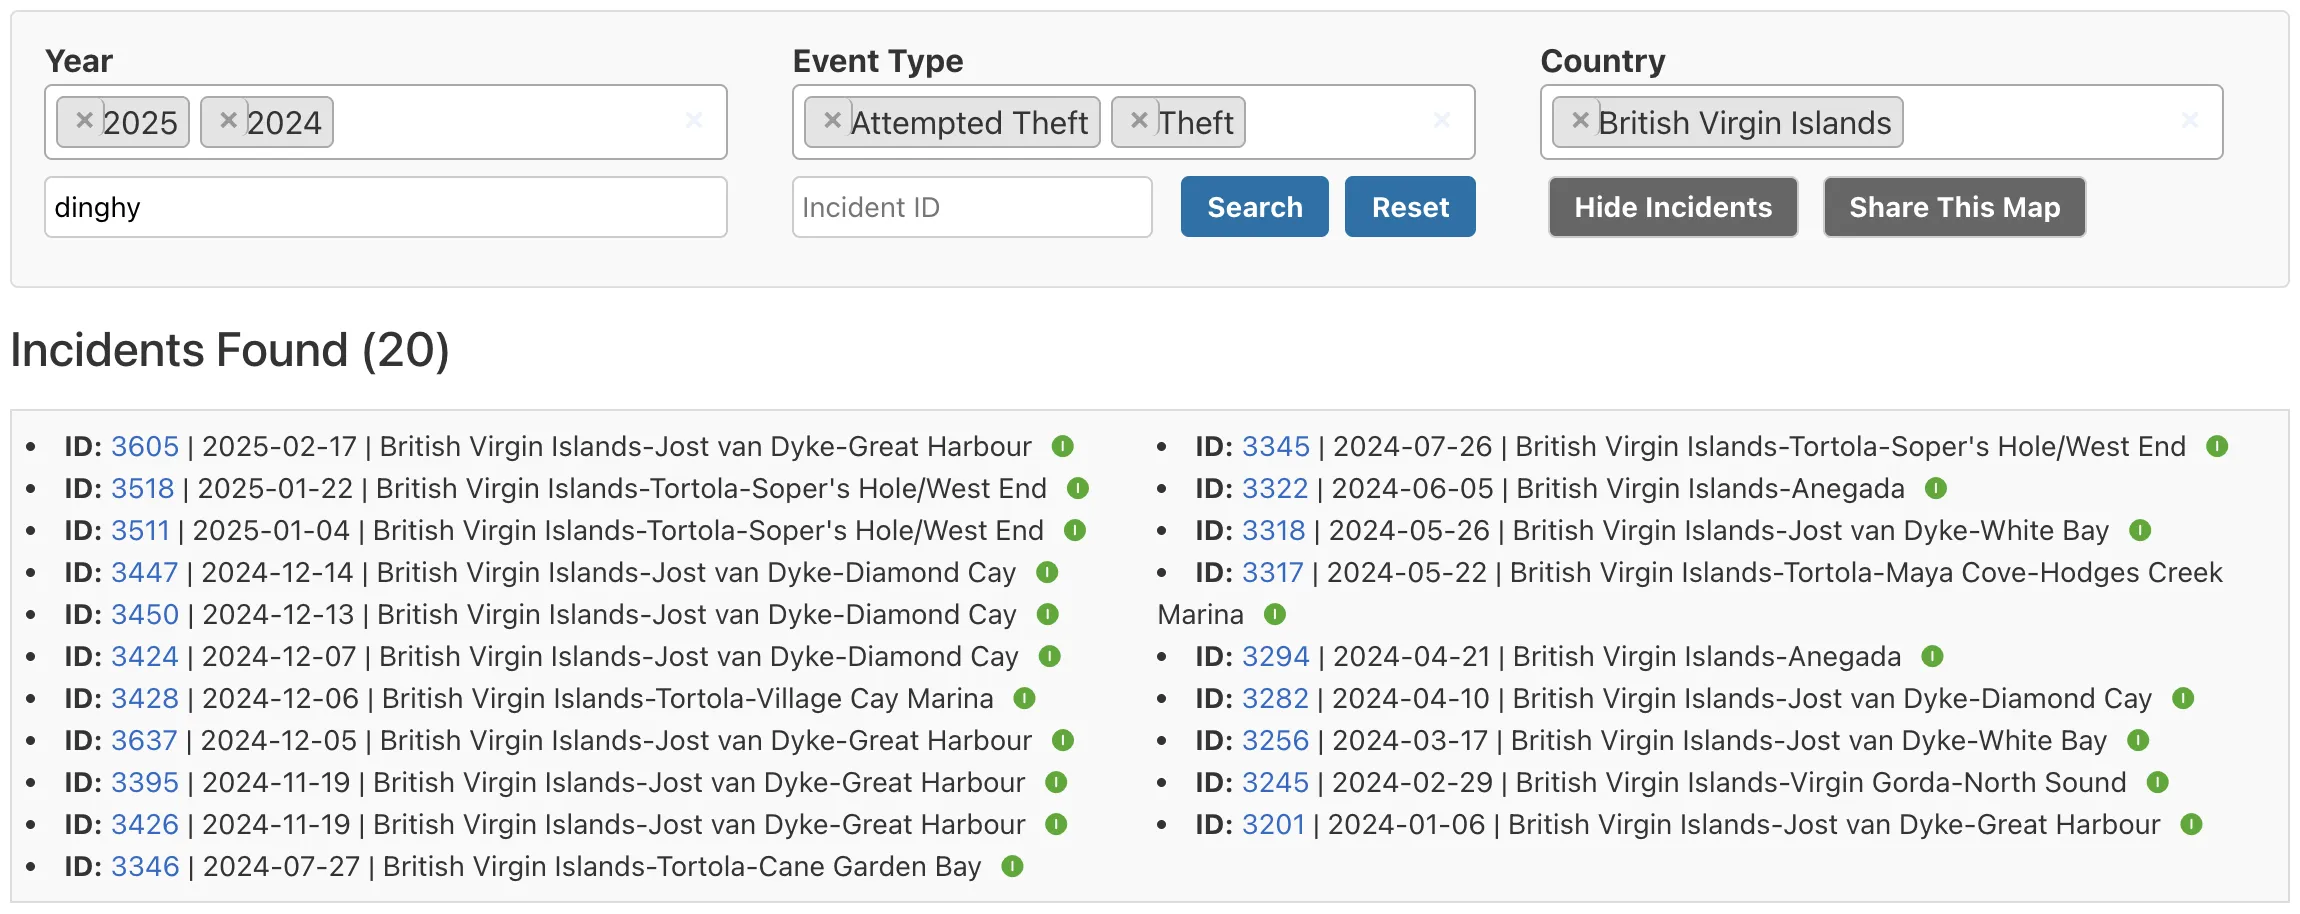
Example of the incident listing that appears below the map with sortable data and clickable incident IDs
Pro Tip: Use both the map and the list together. The map shows you geographic patterns (like "incidents cluster around this area"), while the list gives you the details to understand what's actually happening.
4. Share Your Research
The Share Feature
The "Share This Map" button creates a short link that saves everything about your current view:
All your filter selections (years, countries, event types, search terms)
Your exact map position and zoom level
The specific results you're looking at
How to Use It
Set up your search exactly how you want it
Position and zoom the map to show the area you're interested in
Click "Share This Map"
A short link is automatically copied to your clipboard
Paste it anywhere – email, text message, or bookmark it
Sharing Scenarios:
• Crew Briefing: Research security issues for your planned route/destination and send the link to your crew before departure
• Buddy Boating: Share your research with other boats heading to the same destination
• Future Reference: Bookmark your research to check for updates before your next visit
5. Mobile Experience
The Interactive Map works seamlessly on phones and tablets:
Touch Controls: Pinch to zoom, tap to select, drag to pan
Responsive Design: Side panels become bottom panels for easier viewing
Optimized Filters: Search interface adapts for smaller screens
Single-Column Lists: Incident details display clearly on narrow screens
6. Understanding the Color System
Each incident type has its own color to help you quickly identify patterns:
Event Type
Color
Theft
Green
Burglary
Orange
Attempted Theft
Teal
Piracy
Purple
Assault
Red
Other
Olive
Assault Resulting in Death
Dark Red
Attempted Piracy
Light Purple
Vandalism
Brown
Robbery
Blue
Attempted Burglary
Light Orange
Suspicious Activity
Gray
Attempted Robbery
Blue/Purple
These same colors are used consistently across our interactive map and statistics charts.
7. Additional Examples
Planning Your Route:
You're sailing south for the hurricane season and want to research potential stops. Filter for "St. Vincent and the Grenadines" then search for recent years. The map shows you which anchorages have had reported incidents; read the details and decide how you would route or prepare.
Equipment Purchase Research:
Before buying used outboards and dinghies, enter the HIN and serial number info to see if the items have been reported stolen to the CSSN.
Community Safety Coordination:
Several boats are planning to raft up in a remote anchorage. You research the area, find some concerning recent incidents, and share the link with the group to discuss additional security measures.
8. Tips for Effective Research
Start Broad, Then Narrow: Begin with your destination country, then add specific years or event types
Use Multiple Search Terms: Try different words for the same thing ("outboard," "motor," "engine")
Check Both Recent and Historical: Recent incidents show current conditions; historical data shows long-term patterns
Read the Full Details: The map shows where, but the incident descriptions tell you the specifics – how and when
Save Your Research: Use the share feature to bookmark useful searches for future reference
9. Common Questions
Why don't I see incidents for certain areas?
Incidents only appear where they've been reported to us and verified. Empty areas might mean no incidents occurred, or that incidents haven't been reported through our network.
How current is the information?
We update the map regularly as new incidents are reported and verified. Recent incidents may take a few days to appear while we confirm details with the victims.
What if I need more detailed analysis?
Visit our Statistics Charts for trend analysis, or use the map's share feature to send us your question by email. Use the "Contact Us" button found at the bottom of each page.